

SIAsoft for Sequential Injection Analysis
FIAlab believes that quality software is just as important as hardware. That’s why we created SIAsoft. This software was created with one goal in mind: to maximize ease of use without sacrificing the utility of many tools inherent in the software. The end product is a sleek, powerful control platform that will surely broaden your ability to operate our SIA instruments. Read on to learn about all the features of the software.
Product Highlights

Fast Configuration
Autodetect and configure many devices including SIA instruments, autosamplers, external pumps, etc.

Improved Sample Entry
Enter samples while the method is running. Edit sample tables easily. Easy import from LIMS. Supports rapid entry methods – i.e. bar code scanners.

Enhanced Plotting Capabilities
Smooth zooming, panning and detail inspection of data on all data plots.

Plot Inspection
Inspect individual peaks, entire runs, time slices, and more with a single click.
3D Heat Map
This new feature plots absorbance readings across the entire spectrum for a single peak in order to monitor multiple wavelengths at once.

GUI Control
Clean GUI with a “point and click” functionality to maximize visual control.

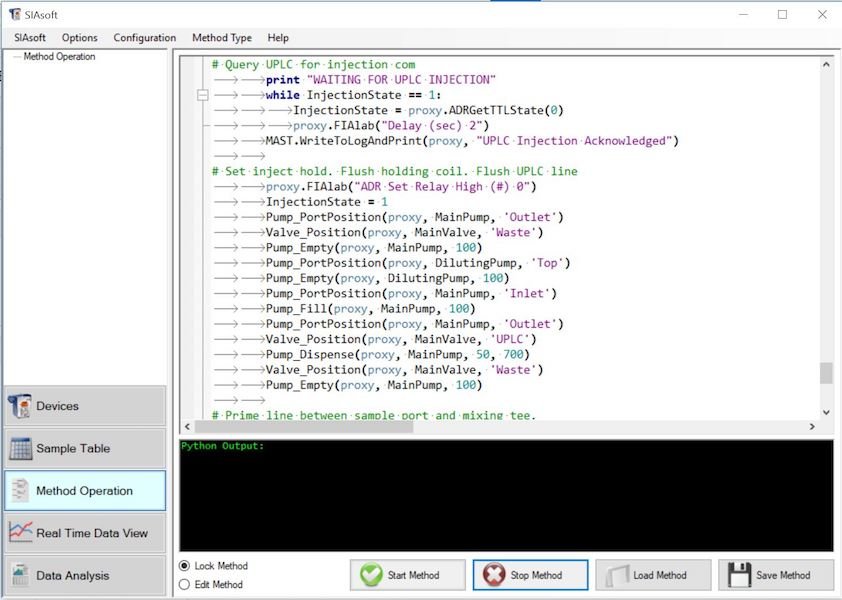
Python Scripting
SIAsoft’s built-in Python interface allows users to harness the power and flexibility of Python to create unique and functional scripts. This added freedom allows them to tune FIAlab analyzers to best fit their laboratory and business needs. If you do not wish to use Python-based scripts, you can stick to traditional FIAlab commands.
Afraid of coding a method from scratch? Don't worry! Our engineers will get you on your feet by developing your initial method script. We can do so in Python or classic FIAlab scripting and is included with any instrument purchase.
Customization services
Observe your data in a new light! This 3D Heat map will show you the relative absorbance readings of your samples across any range of wavelengths. Choose to observe your samples at any point in the assay like this. This tool can demonstrate flow patterns of your samples and help identify various species in them as well.
Software Screenshots
Calibration Curve
The calibration curve features first order and second order polynomial fitting and R^2 values.
Component Controls
Easily control all of your devices through the software with point and click.
Detailed Results
All the information you'll need from your samples can be found here.
Real-time Data View
Observe your samples as they are detected. There is no need to wait for your samples to process before seeing the results.
Sample Table
Rapidly enter samples within SIAsoft or from a CSV file. SIAsoft can launch programs like Excel and Notepad to streamline sample entries.
View by Peak
Visually inspect your individual samples with this tool.
View by Run
Observe your entire run in a single window.
Request a Quote
If you would like more information or a quote of our products, please email: sales@flowinjection.com
Or, call us at 800-963-1101. One of our expert sales staff will be sure to help you.